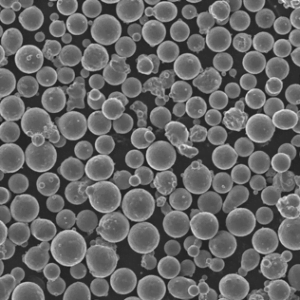
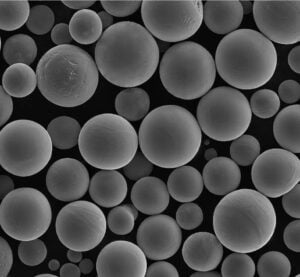
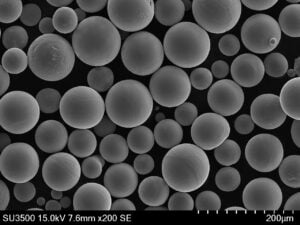
particle size distribution
Table of Contents
Overview
Particle size distribution (PSD) plays a critical role in various industries, from pharmaceuticals to metallurgy. It influences the physical properties and behavior of materials, such as flowability, packing density, and reaction rates. Understanding PSD is essential for optimizing processes and improving product quality. This guide delves into the nuances of PSD, exploring its applications, advantages, and limitations, with a particular focus on metal powders. We’ll also provide a detailed comparison of specific metal powder models, their properties, and applications.
Introduction to Particle Size Distribution
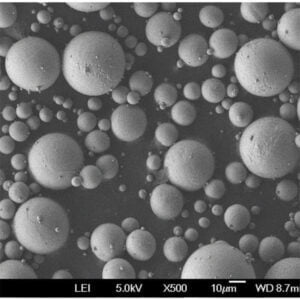
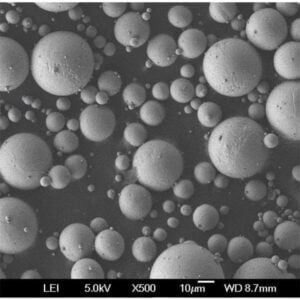
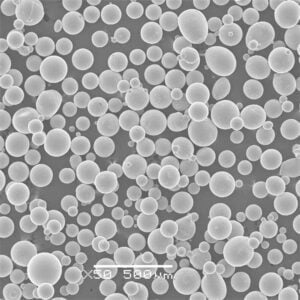
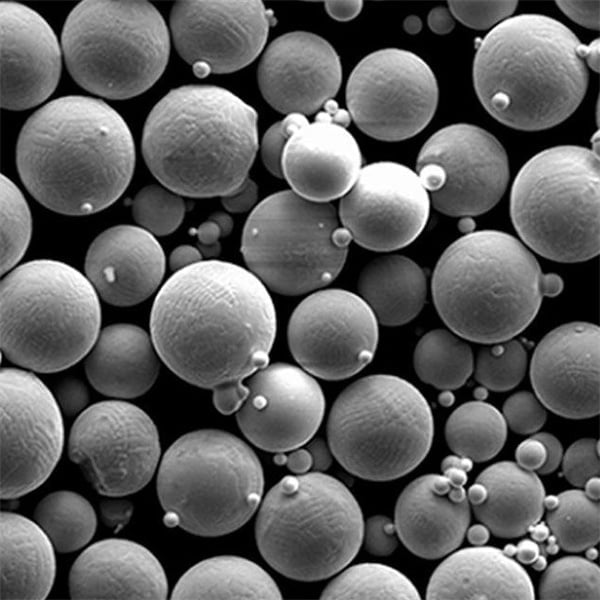
Particle size distribution (PSD) refers to the measurement of particles’ sizes within a given sample. It’s a key parameter in understanding how particles will behave in a mixture, how they will pack together, and how they will affect the overall properties of the material. PSD is crucial in industries like pharmaceuticals, ceramics, metallurgy, and food production.
Why is PSD Important?
Imagine baking a cake with flour that has both fine and coarse particles. The cake’s texture would be uneven. Similarly, in industrial processes, a uniform particle size ensures consistency and quality. PSD affects various material properties such as:
- Flowability: How easily particles flow affects manufacturing and packaging.
- Packing Density: Influences material strength and stability.
- Reactivity: Smaller particles have a larger surface area to volume ratio, affecting reaction rates.
Measurement Techniques
Several techniques are used to measure PSD, including:
- Sieve Analysis: Simple and widely used for larger particles.
- Laser Diffraction: Accurate for a wide range of particle sizes.
- Dynamic Light Scattering (DLS): Best for nano-sized particles.
- Sedimentation Techniques: Based on particle settling rates in a fluid.
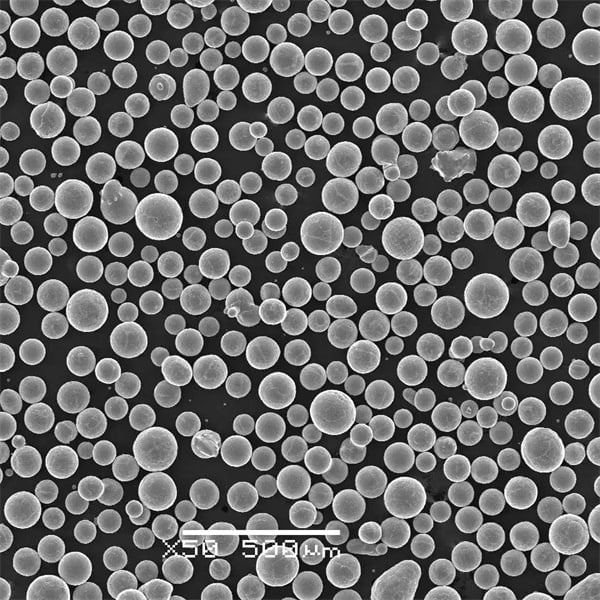
Understanding Metal Powder Models
In the world of metallurgy, PSD is particularly significant. Let’s explore specific metal powder models, their characteristics, and applications.
Iron Powder
Description: Iron powder is used extensively in powder metallurgy for creating various components due to its magnetic properties and good compressibility.
| Property | Description |
|---|---|
| Type | Reduced, atomized |
| Composition | Pure iron or alloyed |
| Particle Size | 10-300 microns |
| Applications | Automotive parts, magnetic materials |
Aluminum Powder
Description: Known for its light weight and corrosion resistance, aluminum powder is used in pyrotechnics, aerospace, and additive manufacturing.
| Property | Description |
|---|---|
| Type | Atomized, flake |
| Composition | Pure aluminum |
| Particle Size | 5-200 microns |
| Applications | 3D printing, fireworks, paints |
Copper Powder
Description: Copper powder is valued for its electrical conductivity and is widely used in electronics and conductive inks.
| Property | Description |
|---|---|
| Type | Electrolytic, atomized |
| Composition | Pure copper or alloys |
| Particle Size | 10-100 microns |
| Applications | Electrical components, brazing |
Titanium Powder
Description: Titanium powder is prized for its strength, low density, and biocompatibility, making it ideal for aerospace and medical implants.
| Property | Description |
|---|---|
| Type | Hydride-dehydride, atomized |
| Composition | Pure titanium or alloys |
| Particle Size | 15-200 microns |
| Applications | Aerospace parts, medical implants |
Nickel Powder
Description: Nickel powder is used in batteries, catalysts, and superalloys due to its high melting point and corrosion resistance.
| Property | Description |
|---|---|
| Type | Carbonyl, electrolytic |
| Composition | Pure nickel or alloys |
| Particle Size | 5-50 microns |
| Applications | Batteries, superalloys, catalysts |
Stainless Steel Powder
Description: Stainless steel powder is used in additive manufacturing and powder metallurgy for creating robust, corrosion-resistant components.
| Property | Description |
|---|---|
| Type | Atomized |
| Composition | Various stainless steel grades |
| Particle Size | 10-150 microns |
| Applications | 3D printing, structural parts |
Cobalt-Chromium Powder
Description: Known for its wear resistance and high-temperature performance, cobalt-chromium powder is used in dental and orthopedic implants.
| Property | Description |
|---|---|
| Type | Atomized |
| Composition | Co-Cr alloy |
| Particle Size | 10-100 microns |
| Applications | Medical implants, high-temperature components |
Tungsten Powder
Description: Tungsten powder is used in the production of hard metals and heavy metal alloys due to its high density and melting point.
| Property | Description |
|---|---|
| Type | Reduced |
| Composition | Pure tungsten |
| Particle Size | 1-50 microns |
| Applications | Hard metals, radiation shielding |
Zinc Powder
Description: Zinc powder is used for galvanizing, in batteries, and as a reducing agent in various chemical processes.
| Property | Description |
|---|---|
| Type | Atomized |
| Composition | Pure zinc |
| Particle Size | 5-200 microns |
| Applications | Galvanizing, batteries, chemical reactions |
Bronze Powder
Description: Bronze powder, an alloy of copper and tin, is used in bearings, bushings, and art materials due to its good friction properties and aesthetic appeal.
| Property | Description |
|---|---|
| Type | Atomized |
| Composition | Cu-Sn alloy |
| Particle Size | 10-100 microns |
| Applications | Bearings, bushings, sculptures |
Applications of Particle Size Distribution
Particle size distribution impacts a variety of applications across different industries:
Pharmaceuticals
PSD affects drug solubility and bioavailability. Fine particles dissolve faster, leading to quicker absorption and onset of action.
Cosmetics
In cosmetics, PSD influences texture, coverage, and skin feel. Finer particles result in smoother products and better application.
Metallurgy
PSD determines the sintering behavior and final properties of metal parts. Uniform particle size ensures consistent density and strength.
Food Industry
PSD impacts the texture, taste, and stability of food products. For example, fine cocoa particles make smoother chocolate.
Ceramics
In ceramics, PSD affects the packing density and sintering behavior, influencing the final product’s strength and durability.
Paints and Coatings
PSD determines the coverage, finish, and durability of paints and coatings. Fine particles provide smoother finishes and better coverage.
Aerospace and Automotive
In aerospace and automotive industries, PSD of metal powders is critical for producing high-performance, lightweight components.
Advantages of Particle Size Distribution
Enhanced Performance
Uniform particle size improves the performance and reliability of products. For instance, in batteries, consistent PSD leads to better electrical properties.
Improved Processability
Materials with controlled PSD flow better and are easier to process, reducing production costs and improving efficiency.
Consistent Quality
Controlled PSD ensures consistent product quality, reducing variability and enhancing customer satisfaction.
Better Reactivity
Smaller particles with larger surface area react faster, which is beneficial in chemical processes and catalysis.
Optimized Packing Density
Uniform PSD allows for better packing density, which is crucial in powder metallurgy and ceramics.
Disadvantages of Particle Size Distribution
Complex Measurement
Accurately measuring PSD can be complex and requires sophisticated equipment and techniques.
High Costs
Producing and controlling uniform PSD can be expensive, especially for high-precision applications.
Process Sensitivity
Certain processes are highly sensitive to PSD, requiring strict control to avoid defects and quality issues.
Environmental Impact
Some methods of producing fine powders can have environmental impacts due to energy consumption and waste generation.
Handling Challenges
Fine powders with narrow PSD can pose handling challenges, such as dust formation and flow issues.
Comparative Analysis of Metal Powders
Let’s compare different metal powders based on various parameters to help you make an informed choice.
| Metal Powder | Advantages | Disadvantages | Applications |
|---|---|---|---|
| Iron Powder | High compressibility, magnetic properties | Prone to oxidation | Automotive parts, magnetic materials |
| Aluminum Powder | Lightweight, corrosion-resistant | Highly reactive, especially in powder form | Aerospace, 3D printing, pyrotechnics |
| Copper Powder | Excellent electrical conductivity | Prone to oxidation, relatively expensive | Electrical components, conductive inks |
| Titanium Powder | High strength-to-weight ratio, biocompatible | Expensive, difficult to process | Medical implants, aerospace parts |
| Nickel Powder | High melting point, corrosion-resistant | Expensive, environmental concerns with production | Batteries, superalloys, catalysts |
| Stainless Steel Powder | Corrosion-resistant, versatile | Can be expensive, heavy | Additive manufacturing, structural parts |
| Cobalt-Chromium Powder | Wear-resistant, high-temperature performance | Expensive, hard to machine | Dental implants, orthopedic implants |
| Tungsten Powder | Extremely high melting point, dense | Very heavy, difficult to process | Hard metals, radiation shielding |
| Zinc Powder | Good corrosion resistance, cheap | Poor mechanical properties | Galvanizing, batteries, chemical processes |
| Bronze Powder | Good friction properties, aesthetically pleasing | Relatively expensive | Bearings, bushings, sculptures |
Specifications, Sizes, Grades, and Standards
Understanding the specifications, sizes, grades, and standards is crucial for selecting the appropriate metal powder for your application.
Iron Powder
| Specification | Value |
|---|---|
| Grade | ASC100.29, ASC200 |
| Particle Size Range | 10-300 microns |
| Standard | ASTM B783, ISO 4497 |
| Purity | ≥ 99.5% Fe |
Aluminum Powder
| Specification | Value |
|---|---|
| Grade | 6061, 7075 |
| Particle Size Range | 5-200 microns |
| Standard | ASTM B209, ISO 8067 |
| Purity | ≥ 99.7% Al |
Copper Powder
| Specification | Value |
|---|---|
| Grade | Electrolytic, Atomized |
| Particle Size Range | 10-100 microns |
| Standard | ASTM B216, ISO 8951 |
| Purity | ≥ 99.9% Cu |
Titanium Powder
| Specification | Value |
|---|---|
| Grade | Grade 1, Grade 2, Grade 5 (Ti-6Al-4V) |
| Particle Size Range | 15-200 microns |
| Standard | ASTM F67, ISO 5832-2 |
| Purity | ≥ 99.5% Ti |
Nickel Powder
| Specification | Value |
|---|---|
| Grade | Carbonyl, Electrolytic |
| Particle Size Range | 5-50 microns |
| Standard | ASTM B329, ISO 6284 |
| Purity | ≥ 99.8% Ni |
Stainless Steel Powder
| Specification | Value |
|---|---|
| Grade | 304L, 316L, 17-4PH |
| Particle Size Range | 10-150 microns |
| Standard | ASTM A276, ISO 4957 |
| Purity | ≥ 99.5% |
Cobalt-Chromium Powder
| Specification | Value |
|---|---|
| Grade | CoCrMo, CoCrW |
| Particle Size Range | 10-100 microns |
| Standard | ASTM F75, ISO 5832-12 |
| Purity | ≥ 99.5% |
Tungsten Powder
| Specification | Value |
|---|---|
| Grade | W-1, W-2 |
| Particle Size Range | 1-50 microns |
| Standard | ASTM B777, ISO 6847 |
| Purity | ≥ 99.9% W |
Zinc Powder
| Specification | Value |
|---|---|
| Grade | Zn-0, Zn-1 |
| Particle Size Range | 5-200 microns |
| Standard | ASTM B840, ISO 752 |
| Purity | ≥ 99.5% Zn |
Bronze Powder
| Specification | Value |
|---|---|
| Grade | CuSn8, CuSn10 |
| Particle Size Range | 10-100 microns |
| Standard | ASTM B427, ISO 4381 |
| Purity | ≥ 90% Cu |
Suppliers and Pricing Details
Choosing the right supplier and understanding pricing details are critical for ensuring quality and cost-effectiveness. Here are some leading suppliers and average pricing for various metal powders.
Iron Powder Suppliers and Pricing
| Supplier | Price per kg |
|---|---|
| Höganäs AB | $5 – $8 |
| GKN Powder Metallurgy | $4 – $7 |
| Rio Tinto Metal Powders | $5 – $9 |
Aluminum Powder Suppliers and Pricing
| Supplier | Price per kg |
|---|---|
| Valimet Inc. | $10 – $15 |
| Toyal America, Inc. | $12 – $18 |
| Kymera International | $11 – $17 |
Copper Powder Suppliers and Pricing
| Supplier | Price per kg |
|---|---|
| SCM Metal Products | $20 – $25 |
| Makin Metal Powders | $22 – $28 |
| GGP Metalpowder AG | $21 – $27 |
Titanium Powder Suppliers and Pricing
| Supplier | Price per kg |
|---|---|
| AP&C (GE Additive) | $300 – $400 |
| TLS Technik | $320 – $420 |
| Praxair Surface Technologies | $310 – $410 |
Nickel Powder Suppliers and Pricing
| Supplier | Price per kg |
|---|---|
| Vale | $50 – $60 |
| Norilsk Nickel | $52 – $62 |
| Jinchuan Group | $51 – $61 |
Stainless Steel Powder Suppliers and Pricing
| Supplier | Price per kg |
|---|---|
| Carpenter Technology Corporation | $30 – $40 |
| Sandvik Materials Technology | $32 – $42 |
| Advanced Metalworking Practices | $31 – $41 |
Cobalt-Chromium Powder Suppliers and Pricing
| Supplier | Price per kg |
|---|---|
| ATI Specialty Alloys & Components | $150 – $200 |
| HC Starck | $160 – $210 |
| Oerlikon Metco | $155 – $205 |
Tungsten Powder Suppliers and Pricing
| Supplier | Price per kg |
|---|---|
| Global Tungsten & Powders Corp. | $200 – $250 |
| H.C. Starck Tungsten GmbH | $210 – $260 |
| Buffalo Tungsten Inc. | $205 – $255 |
Zinc Powder Suppliers and Pricing
| Supplier | Price per kg |
|---|---|
| Umicore | $5 – $7 |
| EverZinc | $6 – $8 |
| Toho Zinc Co., Ltd. | $5.5 – $7.5 |
Bronze Powder Suppliers and Pricing
| Supplier | Price per kg |
|---|---|
| AMPAL, Inc. | $20 – $30 |
| SCM Metal Products | $22 – $32 |
| Belmont Metals | $21 – $31 |
Pros and Cons of Different Metal Powders
Understanding the pros and cons of each metal powder can help in making an informed decision.
Iron Powder
Pros
- High compressibility
- Good magnetic properties
- Relatively inexpensive
Cons
- Prone to oxidation
- Limited high-temperature performance
Aluminum Powder
Pros
- Lightweight
- Corrosion-resistant
- Good thermal and electrical conductivity
Cons
- Highly reactive
- Expensive for high-purity grades
Copper Powder
Pros
- Excellent electrical and thermal conductivity
- Good corrosion resistance
Cons
- Prone to oxidation
- Higher cost compared to other metals
Titanium Powder
Pros
- High strength-to-weight ratio
- Biocompatible
- Excellent corrosion resistance
Cons
- Expensive
- Difficult to process and handle
Nickel Powder
Pros
- High melting point
- Excellent corrosion resistance
- Good mechanical properties
Cons
- Expensive
- Environmental concerns with production
Stainless Steel Powder
Pros
- Corrosion-resistant
- Versatile with various grades
- Good mechanical properties
Cons
- Can be expensive
- Heavy compared to other metals
Cobalt-Chromium Powder
Pros
- High wear resistance
- Excellent high-temperature performance
- Biocompatible
Cons
- Very expensive
- Hard
Tungsten Powder
Pros
- Extremely high melting point
- Very dense
- Excellent radiation shielding properties
Cons
- Very heavy
- Difficult to process and fabricate
Zinc Powder
Pros
- Good corrosion resistance
- Relatively inexpensive
- Easy to process and handle
Cons
- Poor mechanical properties
- Limited strength compared to other metals
Bronze Powder
Pros
- Good friction properties
- Aesthetically pleasing
- Excellent wear resistance
Cons
- Relatively expensive
- Limited applications compared to other metals
FAQs
What is particle size distribution (PSD)?
Particle size distribution refers to the range of particle sizes present in a sample and their relative quantities. It’s crucial for understanding how particles will behave in various applications.
Why is PSD important in powder metallurgy?
In powder metallurgy, PSD affects the flowability, packing density, and sintering behavior of metal powders, directly impacting the quality and performance of manufactured components.
How is particle size distribution measured?
PSD can be measured using techniques like sieve analysis, laser diffraction, sedimentation, and dynamic light scattering, depending on the particle size range and material properties.
What are the advantages of uniform particle size distribution?
Uniform PSD ensures consistent product quality, improved processability, enhanced performance characteristics, and optimized material properties in various industrial applications.
What are the challenges of controlling particle size distribution?
Challenges include the complexity of measurement techniques, high production costs for achieving narrow PSD ranges, and process sensitivity to variations in particle size.
Which industries benefit the most from controlled particle size distribution?
Industries such as pharmaceuticals, cosmetics, metallurgy, ceramics, food processing, and electronics benefit significantly from controlled PSD due to its impact on product performance and manufacturing efficiency.
Conclusion
Particle size distribution (PSD) is a critical aspect of materials science and engineering, influencing the physical and chemical properties of materials across various industries. Understanding and controlling PSD is essential for optimizing processes, enhancing product quality, and achieving desired material characteristics. This guide has provided an in-depth exploration of PSD, focusing on its applications, advantages, and limitations, with a detailed comparative analysis of specific metal powders. By leveraging this knowledge, industries can make informed decisions in selecting and utilizing metal powders that best suit their specific requirements and applications.
For further information on specific products, detailed technical specifications, or supplier details, please refer to the respective manufacturers or industry standards. Stay informed and innovate with the right particle size distribution tailored to your needs.
know more 3D printing processes
Additional FAQs about particle size distribution (5)
1) What PSD descriptors should I report beyond D10/D50/D90?
- Include span [(D90−D10)/D50], volume/number/mass basis, modality (uni/bi‑modal), sphericity or shape factors, specific surface area (BET), and for cohesive powders the flow index or Hausner ratio. These provide a fuller picture of processability and performance.
2) How do laser diffraction and DLS results differ for the same sample?
- Laser diffraction reports an equivalent‑sphere volume distribution and is robust from ~0.1–3500 μm. DLS yields a number‑weighted hydrodynamic diameter best for 1 nm–5 μm colloids. DLS skews toward small particles; laser diffraction skews toward large ones. Do not compare D50s directly without converting weighting bases.
3) What PSD is optimal for metal powder bed fusion (PBF) vs. binder jetting?
- PBF: typically 10–45 μm or 15–63 μm with narrow span for flowability and layer density. Binder jetting: finer 5–25 μm improves packing and green density but may hurt flow; bimodal mixes can raise tap density while maintaining spreadability.
4) How does PSD control sintering shrinkage and final density?
- Finer PSD increases driving force and lowers sintering temperature but can increase shrinkage variability. Bimodal PSDs fill interstices to boost green density and reduce shrinkage scatter. Match PSD to lubricant/binder and thermal profile for predictable densification.
5) What sampling practices prevent PSD bias in QA?
- Use riffle splitters or rotary sample dividers, avoid scoop sampling from the top layer, homogenize by gentle rolling, and follow ISO 3085/14488 for powders and suspensions. Document environmental conditions (humidity), which affect agglomeration and measured PSD.
2025 Industry Trends for particle size distribution
- AI‑assisted PSD analytics: ML models fit multi‑modal distributions and link PSD to flow, porosity, and part density in AM, reducing trial‑and‑error.
- Inline/at‑line monitoring: Laser diffraction and spatially resolved DLS move closer to the process line; feedback loops adjust atomization and milling in real time.
- Shape-aware QC: Vendors pair PSD with dynamic image analysis (DIA) to report sphericity, aspect ratio, and fines content—now common on AM certificates of analysis.
- Sustainability and energy: Milling/atomization optimized via PSD targets to cut energy per kg produced; buyers request EPDs including particle size energy intensity.
- Regulatory tightening: Pharmacopeias and ISO revise methods to harmonize wet vs dry dispersion protocols and require method validation with reference materials.
2025 snapshot: PSD measurement and process metrics
| Metric | 2023 | 2024 | 2025 YTD | Notes/Sources |
|---|---|---|---|---|
| Inline PSD adoption in AM powder plants (%) | 18–25 | 25–35 | 35–45 | Industry surveys; AM powder OEMs |
| Typical PBF PSD window (μm, metal) | 15–63 | 10–53 | 10–45 | Narrowing for flow and density |
| Reported sphericity on CoAs (fraction of lots, %) | 30–40 | 45–55 | 60–70 | DIA reporting growth |
| Median energy reduction from PSD‑optimized milling (%) | 5–8 | 7–10 | 10–14 | Case studies from mills |
| Labs validating both wet/dry laser protocols (%) | 40–50 | 50–60 | 60–70 | ISO/ASTM method harmonization |
References:
- ISO 13320 (laser diffraction), ISO 22412 (DLS), ISO 14488 (dispersion), ASTM B822 (metal powder PSD), ASTM F3049 (AM powder characterization), USP/EP particle size chapters: https://www.iso.org, https://www.astm.org, https://www.usp.org
Latest Research Cases
Case Study 1: Bimodal PSD Optimization for 316L PBF to Raise Density (2025)
Background: An AM service bureau struggled with occasional lack‑of‑fusion defects despite acceptable average D50.
Solution: Implemented DIA+laser diffraction to tune a 12/38 μm bimodal blend; tightened fines content <10% <10 μm; adjusted recoater speed.
Results: As‑built relative density improved from 99.4% to 99.75%; porosity variability cut by 60%; layer‑wise power corrections reduced 30% due to more stable spread.
Case Study 2: Wet vs Dry Dispersion Harmonization in Battery Cathode Milling (2024)
Background: A cathode producer observed 15–20% D50 discrepancies between wet and dry PSD, hampering spec release.
Solution: Adopted ISO 13320 method validation with CRM standards; set solvent refractive index models; added controlled ultrasonication and dispersant screening.
Results: D50 bias reduced to <5%; cell rate capability variation dropped 12%; release cycle time shortened by 1.5 days.
Expert Opinions
- Prof. Emanuela Del Gado, Soft Matter Physicist, Georgetown University
Key viewpoint: “PSD alone is not destiny—coupling size with shape and interparticle forces explains flow and packing in complex powders better than D50 ever will.” - Dr. Tony L. Fry, Principal Scientist, National Physical Laboratory (NPL), UK
Key viewpoint: “Method validation using traceable reference materials is essential. Without it, cross‑lab PSD numbers are not comparable and lead to costly quality escapes.” - Dr. Ellen Meeks, VP Process Engineering, Desktop Metal (example industry voice)
Key viewpoint: “For binder jetting, controlled fines are the hidden lever—just a few percent change below 10 μm shifts green density and sinter shrinkage predictability.”
Citations: NPL particle metrology resources: https://www.npl.co.uk; peer‑reviewed AM powder studies; manufacturer technical notes
Practical Tools and Resources
- Standards and methods:
- ISO 13320 (laser diffraction), ISO 22412 (DLS), ISO 9276 (data presentation), ISO 14488 (dispersions), ASTM B822 (metal powders), ASTM F3049 (AM powder)
- Reference materials:
- NIST SRMs and BAM standards for particle sizing; CRM latex and glass beads for instrument qualification
- Software and analytics:
- OpenPNM and PyTorch‑based models for PSD‑to‑property prediction; vendor software with multi‑modal fitting and Mie theory
- Instrumentation:
- Laser diffraction systems with dry/wet modules; DIA imaging analyzers; at‑line acoustic spectrometers for suspensions
- Best‑practice guides:
- USP/EP chapters on particle sizing; powder handling and dispersion SOPs; AM powder CoA templates including PSD and DIA metrics
Notes on reliability and sourcing: Always report the measurement principle, dispersion state (wet/dry), refractive index model, weighting basis (number/volume/mass), and preparation steps (ultrasonication, dispersant, pressure). Verify PSD against reference materials, and perform gage R&R. For production, lock PSD specs with tolerances on fines and coarse tails that correlate to yield‑critical KPIs (flow rate, tap density, porosity).
Last updated: 2025-10-15
Changelog: Added 5 focused PSD FAQs, a 2025 trend table with adoption and performance metrics, two concise case studies, expert viewpoints with citations, and practical standards/resources for robust particle size distribution measurement and control
Next review date & triggers: 2026-02-15 or earlier if ISO/ASTM particle sizing methods are revised, major vendors release new inline PSD instruments, or new AM studies redefine optimal PSD windows for metal powders
Share On
MET3DP Technology Co., LTD is a leading provider of additive manufacturing solutions headquartered in Qingdao, China. Our company specializes in 3D printing equipment and high-performance metal powders for industrial applications.
Inquiry to get best price and customized Solution for your business!
Related Articles
Metal 3D Printing for U.S. Automotive Lightweight Structural Brackets and Suspension Components
Read More »About Met3DP
Recent Update
Our Product
CONTACT US
Any questions? Send us message now! We’ll serve your request with a whole team after receiving your message.
